
ચિત્ર:Food production per capita 1961-2005.png
આથી વધુ ઘનત્વ ઉપલબ્ધ નથી.
Food_production_per_capita_1961-2005.png (૪૩૬ × ૪૮૧ પીક્સલ, ફાઇલનું કદ: ૫ KB, MIME પ્રકાર: image/png)
સારાંશ:

|
File:Food production per capita.svg is a vector version of this file. It should be used in place of this PNG file when not inferior.
File:Food production per capita 1961-2005.png → File:Food production per capita.svg
For more information, see Help:SVG. |
 |
| વર્ણન |
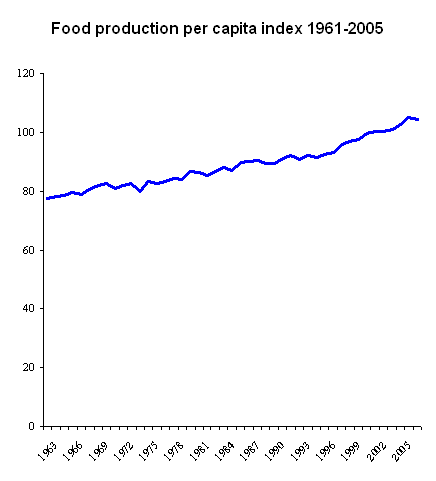
English: The y axis is percent of 1999-2001 average food production per capita
Data source: World Resources Institute. 2006. Available at http://earthtrends.wri.org. Washington DC: World Resources Institute. Meny "Agriculture and Food", submeny "Searchable Database". "Food and Agriculture Organization of the United Nations (FAO). 2006. FAOSTAT Online Statistical Service. Rome: FAO. Available online at: http://apps.fao.org" |
| તારીખ | ૩ સપ્ટેમ્બર ૨૦૦૬ (original upload date) |
| સ્રોત | Transferred from en.wikipedia to Commons. |
| લેખક | Ultramarine at અંગ્રેજી વિકિપીડિયા |
પરવાના
| આ રચના ના લેખક Ultramarine at અંગ્રેજી વિકિપીડિયા દ્વારા આ રચનાને public domain હેઠળ પ્રકાશિત કરાઈ છે. આ સવલત વિશ્વવ્યપી છે અમુક દેશોમાં કાયદેસર રીતે તે શક્ય નથી, જો તેમ હોય તો : Ultramarine દ્વારા કોઈને પણ કોઈપણ વપરાશ, કોઇ પણ શરત વગર, માટે આ રચના વાપરવાની છૂટ આપાઈ છે સિવાયકે તે શરતો કાયદેસર જરૂરી હોય. |
અસલ - મૂળ અપલોડનો લોગ
The original description page was here. All following user names refer to en.wikipedia.
- 2006-09-03 10:52 Ultramarine 436×481×8 (5459 bytes) == Summary == The y axis is percent of 1999-2001 average food production per capita Data source: World Resources Institute. 2006. Available at http://earthtrends.wri.org. Washington DC: World Resources Institute. "Food and Agriculture Organization of th
ફાઇલનો ઇતિહાસ
તારીખ/સમય ઉપર ક્લિક કરવાથી તે સમયે ફાઇલ કેવી હતી તે જોવા મળશે.
| તારીખ/સમય | લઘુચિત્ર | પરિમાણો | સભ્ય | ટિપ્પણી | |
|---|---|---|---|---|---|
| વર્તમાન | ૧૬:૪૦, ૭ મે ૨૦૦૮ | | ૪૩૬ × ૪૮૧ (૫ KB) | Renamed user ixgysjijel | {{Information |Description={{en|The y axis is percent of 1999-2001 average food production per capita Data source: World Resources Institute. 2006. Available at http://earthtrends.wri.org. Washington DC: World Resources Institute. Meny "Agriculture and F |
ફાઇલનો વપરાશ
આ ફાઇલને કોઇ પાનાં વાપરતા નથી.
ફાઇલનો વ્યાપક ઉપયોગ
નીચેની બીજી વિકિઓ આ ફાઈલ વાપરે છે:
- ca.wikipedia.org પર વપરાશ
- en.wikipedia.org પર વપરાશ
- es.wikipedia.org પર વપરાશ
- id.wikipedia.org પર વપરાશ
- Portal:Pertanian/Artikel pilihan/2014
- Portal:Pertanian/Artikel pilihan/Minggu 21 2014
- Portal:Pertanian/Artikel pilihan/2015
- Portal:Pertanian/Artikel pilihan/Minggu 9 2015
- Portal:Pertanian/Artikel pilihan/2016
- Portal:Pertanian/Artikel pilihan/Minggu 14 2016
- Portal:Pertanian/Artikel pilihan/2017
- Portal:Pertanian/Artikel pilihan/Minggu 5 2017