
ચિત્ર:Leverage Ratios.png

મૂળભુત ફાઇલ (૯૬૦ × ૭૨૦ પીક્સલ, ફાઇલનું કદ: ૮ KB, MIME પ્રકાર: image/png)
સારાંશ:

|
File:Leverage ratios for major investment banks.svg is a vector version of this file. It should be used in place of this PNG file when not inferior.
File:Leverage Ratios.png → File:Leverage ratios for major investment banks.svg
For more information, see Help:SVG. |
 |
| વર્ણન |
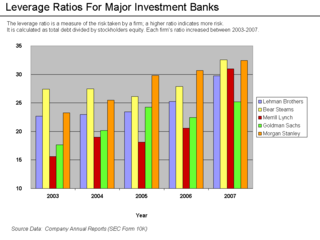
English: Leverage ratios of investment banks ExplanationEach of the five largest investment banks took on greater risk leading up to the subprime crisis. This is summarized by their leverage ratio, which is the ratio of total debt to total equity. A higher ratio indicates more risk. From fiscal years 2003-2007, these firms significantly increased their leverage ratios. A ratio of 10-15 is more typical of a conservative bank. These firms had ratios closer to 30. A highly leveraged institution can have its equity wiped out due to relatively minor swings in the value of its assets. For example, let's suppose an investment bank has $310 in assets, $300 in debt and $10 in equity capital. This is a leverage ratio of 300/10 or 30-to-1. It is an accounting identity (a rule that must be true by definition) that assets equals the sum of liabilities and equity. Now suppose the value of the assets declines by about 3% to $300. The institution still owes its debt holders $300, so equity must be zero. Many financial institutions are facing this scenario. To get more equity or capital, they typically issue new common stock shares to the public in exchange for funds. However, this dilutes the ownership of current shareholders, placing downward pressure on the stock price. When share prices have been reduced as was the case in 2008, a larger and more dilutive issuance of shares is required. In some cases, new share issuance is done at below the current market value. It is noteworthy that the leverage ratios at Morgan Stanley and Goldman Sachs were both under 15 as of Q1 2009, according to their Q1 financial reports available on their websites. Source Datathumb|Source data for the Graph Source data is the 2007 Annual Reports (SEC Form 10K) for each firm. Search the PDF for "Selected Financial Data" so you get the 5-year comparison. Bear's is a bit tougher to find through their website, as it is now part of JP Morgan.
|
| તારીખ | |
| સ્રોત | Annual Reports; Chart by Farcaster |
| લેખક | Farcaster (talk) 19:59, 16 October 2008 (UTC) |
પરવાના
- તમે મુક્ત છો:
- વહેંચવા – નકલ કરવા, વિતરણ કરવા અને રચનાઓ મોકલવા
- રીમિક્સ કરવા કે મઠારવા – રચના અપનાવવા
- નીચેની શરત હેઠળ:
- આરોપણ – તમારે આ રચનાનો ઉપયોગ કરવા માટે લેખક કે પ્રકાશન અધિકાર ધારકની યોગ્ય માહિતી, પરવાનગી (લાયસન્સ)ની કડી અને તેમાં ફેરફાર કર્યો હોય તો તેનો ઉલ્લેખ કરવો જ પડશે. તમે આ સત્તા અનુસાર જ આ રચનાનો પ્રયોગ થવો જોઈએ, પણ તેઓ તમને અથવા તમારા ઉપયોગ સાથે સંમત થાય છે તે રીતે નહીં.
- શેર- અલાઈક (બિન ભેદભાવ વહેંચણી) – તમે જો આ રચનાને બદલશો, તેમાં ફેરફાર કરશો અથવા તેના પર આધારિત કોઇ કાર્ય બનાવશો તો તમારે પરિણામી કાર્યને તે જ અથવા અનુરૂપ પરવાનગી હેઠળ જ પ્રકાશિત કરવું પડશે.

|
આ રચનાની નકલ કરવા, વિતરણ અને સુધારો કરવા માટે GNU Free Documentation License, આવૃત્તિ 1.2 કે અન્ય આગળની આવૃત્તિ Free Software Foundation હેઠળ પરવાનગી છે; જેમાં કોઈ Invariant Sections, no Front-Cover Texts, and no Back-Cover Texts નથી. આ પરવાનાની પ્રત GNU Free Documentation License વિભાગમાં છે. |
અસલ - મૂળ અપલોડનો લોગ
- 2008-10-16 19:59 Farcaster 960×720× (8284 bytes) {{Information |Description=Leverage ratios of investment banks |Source=Annual Reports; Chart by Farcaster |Date=October 16 2008 |Author=~~~~ |other_versions= }}
ફાઇલનો ઇતિહાસ
તારીખ/સમય ઉપર ક્લિક કરવાથી તે સમયે ફાઇલ કેવી હતી તે જોવા મળશે.
| તારીખ/સમય | લઘુચિત્ર | પરિમાણો | સભ્ય | ટિપ્પણી | |
|---|---|---|---|---|---|
| વર્તમાન | ૦૬:૩૨, ૧૪ ઓક્ટોબર ૨૦૧૦ | | ૯૬૦ × ૭૨૦ (૮ KB) | Hideokun | {{Information |Description={{en|Leverage ratios of investment banks<br/> ==Explanation== Each of the five largest investment banks took on greater risk leading up to the subprime crisis. This is summarized by their leverage ratio, which is the ratio of t |
ફાઇલનો વપરાશ
આ ફાઇલ માં નીચેનું પાનું વપરાયેલું છે:
ફાઇલનો વ્યાપક ઉપયોગ
નીચેની બીજી વિકિઓ આ ફાઈલ વાપરે છે:
- en.wikipedia.org પર વપરાશ
- es.wikipedia.org પર વપરાશ
- ga.wikipedia.org પર વપરાશ
- hi.wikipedia.org પર વપરાશ
- ja.wikipedia.org પર વપરાશ
- kn.wikipedia.org પર વપરાશ
- lt.wikipedia.org પર વપરાશ
- ta.wikipedia.org પર વપરાશ