
ચિત્ર:IQ curve.svg

Size of this PNG preview of this SVG file: ૬૦૦ × ૪૮૦ પિક્સેલ. અન્ય આવર્તનો: ૩૦૦ × ૨૪૦ પિક્સેલ | ૯૬૦ × ૭૬૮ પિક્સેલ | ૧,૨૮૦ × ૧,૦૨૪ પિક્સેલ | ૨,૫૬૦ × ૨,૦૪૮ પિક્સેલ.
મૂળભુત ફાઇલ (SVG ફાઇલ, માત્ર ૬૦૦ × ૪૮૦ પીક્સલ, ફાઇલનું કદ: ૯ KB)
સારાંશ:
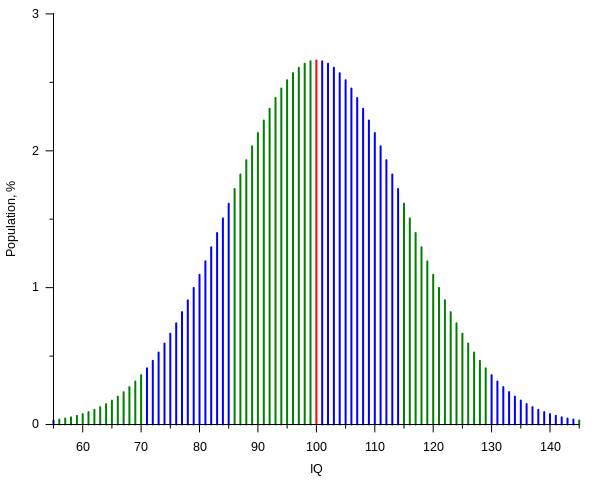
| વર્ણન | Current IQ tests typically have standard scores such that the mean score is 100 with each standard deviation from the mean counting for 15 IQ points.[1] The plot shows, assuming that such scores have a normal distribution, the percentage of people getting a score versus the score itself, from 55 to 145 IQ, that is over a span of six standard deviations. Spans are represented with different colors for each standard deviation above or below the mean. The plot was created with the following gnuplot code: |
| SVG genesis | |
| Source code | Gnuplot codeset terminal svg name 'IQ_curve' size 600,480 font ',10' rounded
set output 'IQ_curve.svg'
mu = 100.0
sigma = 15.0
from = 55
to = 145
# Normal distribution:
# (continuos normalization approximation, good to ~10 digits in this case)
P(x) = exp(-(x - mu)**2 / (2 * sigma**2)) / (sqrt(2 * pi) * sigma) * 100
# By sigma intervals:
oddsi(x) = (int(abs(x - mu) / sigma) % 2) ^ (x < mu)
Pm(x) = (x == mu) ? P(x) : 1/0 # sample at mu
Po(x) = ( oddsi(x) && (x != mu)) ? P(x) : 1/0 # samples in odd sigma intervals
Pe(x) = (!oddsi(x) && (x != mu)) ? P(x) : 1/0 # samples in even sigma intervals
set key off
set border 3
set xlabel 'IQ'
set xtics 10 out nomirror
set mxtics 2
set ylabel 'Population, %'
set ytics 1 out nomirror
set mytics 2
set samples (to - from + 1)
set style function impulses
plot [x = from:to] \
Pm(x) lw 2, \
Po(x) lw 2, \
Pe(x) lw 2
|
| તારીખ | |
| સ્રોત | પોતાની રચના |
| લેખક | Alessio Damato, Mikhail Ryazanov |
- ↑ Kaufman, A.S. (૨૦૦૯) IQ Testing 101, New York (NY): Springer Publishing, pp. 104−109 ISBN: 978-0-8261-0629-2.
પરવાના
હું, આ કાર્યનો પ્રકાશનાધિકાર ધારક, તેને નીચેના પરવાનાઓ હેઠળ અહીં પ્રકાશીત કરૂં છું:

|
આ રચનાની નકલ કરવા, વિતરણ અને સુધારો કરવા માટે GNU Free Documentation License, આવૃત્તિ 1.2 કે અન્ય આગળની આવૃત્તિ Free Software Foundation હેઠળ પરવાનગી છે; જેમાં કોઈ Invariant Sections, no Front-Cover Texts, and no Back-Cover Texts નથી. આ પરવાનાની પ્રત GNU Free Documentation License વિભાગમાં છે. |
| આ ફાઈલ વપરાશની પરવાનગી : Creative Commons Attribution-Share Alike 3.0 Unported license. | ||
| ||
| GFDL licensing update ના ભાગ રૂપે આ પરવાનાનો ટેગ ફાઈલ પર લગાડવામાં આવ્યો છે. |
આ ફાઈલ વપરાશની પરવાનગી : Creative Commons Attribution-Share Alike 2.5 Generic, 2.0 Generic and 1.0 Generic license.
- તમે મુક્ત છો:
- વહેંચવા – નકલ કરવા, વિતરણ કરવા અને રચનાઓ મોકલવા
- રીમિક્સ કરવા કે મઠારવા – રચના અપનાવવા
- નીચેની શરત હેઠળ:
- આરોપણ – તમારે આ રચનાનો ઉપયોગ કરવા માટે લેખક કે પ્રકાશન અધિકાર ધારકની યોગ્ય માહિતી, પરવાનગી (લાયસન્સ)ની કડી અને તેમાં ફેરફાર કર્યો હોય તો તેનો ઉલ્લેખ કરવો જ પડશે. તમે આ સત્તા અનુસાર જ આ રચનાનો પ્રયોગ થવો જોઈએ, પણ તેઓ તમને અથવા તમારા ઉપયોગ સાથે સંમત થાય છે તે રીતે નહીં.
- શેર- અલાઈક (બિન ભેદભાવ વહેંચણી) – તમે જો આ રચનાને બદલશો, તેમાં ફેરફાર કરશો અથવા તેના પર આધારિત કોઇ કાર્ય બનાવશો તો તમારે પરિણામી કાર્યને તે જ અથવા અનુરૂપ પરવાનગી હેઠળ જ પ્રકાશિત કરવું પડશે.
તમે તમારી પસંદગીનો પરવાનો પસંદ કરી શકો છો.
ફાઇલનો ઇતિહાસ
તારીખ/સમય ઉપર ક્લિક કરવાથી તે સમયે ફાઇલ કેવી હતી તે જોવા મળશે.
| તારીખ/સમય | લઘુચિત્ર | પરિમાણો | સભ્ય | ટિપ્પણી | |
|---|---|---|---|---|---|
| વર્તમાન | ૦૪:૪૧, ૨૭ નવેમ્બર ૨૦૨૦ | | ૬૦૦ × ૪૮૦ (૯ KB) | Paranaja | Reverted to version as of 21:27, 2 November 2012 (UTC) |
| ૦૨:૫૭, ૩ નવેમ્બર ૨૦૧૨ |  | ૬૦૦ × ૪૮૦ (૯ KB) | Mikhail Ryazanov | IQ values are now integers; gnuplot-only approach | |
| ૧૪:૫૦, ૬ ડિસેમ્બર ૨૦૦૬ |  | ૬૦૦ × ૪૮૦ (૧૨ KB) | Alejo2083 | {{Information |Description= The IQ test is made so that most of the people will score 100 and the distribution will have the shape of a Gaussian function, with a standard deviation of 15. The plot shows the percentage of people getting a score versus the |
ફાઇલનો વપરાશ
આ ફાઇલને કોઇ પાનાં વાપરતા નથી.
ફાઇલનો વ્યાપક ઉપયોગ
નીચેની બીજી વિકિઓ આ ફાઈલ વાપરે છે:
- ar.wikipedia.org પર વપરાશ
- ast.wikipedia.org પર વપરાશ
- az.wikipedia.org પર વપરાશ
- ba.wikipedia.org પર વપરાશ
- be-tarask.wikipedia.org પર વપરાશ
- be.wikipedia.org પર વપરાશ
- ca.wikipedia.org પર વપરાશ
- cs.wikipedia.org પર વપરાશ
- da.wikipedia.org પર વપરાશ
- de.wikipedia.org પર વપરાશ
- Intelligenzquotient
- Normwert
- Wikipedia:WikiProjekt Psychologie/Archiv
- Benutzer:SonniWP/Hochbegabung
- Kritik am Intelligenzbegriff
- The Bell Curve
- Benutzer:Rainbowfish/Bilder
- Quantitative Psychologie
- Intelligenzprofil
- Benutzer:LauM Architektur/Babel
- Benutzer:LauM Architektur/Babel/Überdurchschnittlicher IQ
- de.wikibooks.org પર વપરાશ
- Elementarwissen medizinische Psychologie und medizinische Soziologie: Theoretisch-psychologische Grundlagen
- Elementarwissen medizinische Psychologie und medizinische Soziologie/ Druckversion
- Elementarwissen medizinische Psychologie und medizinische Soziologie/ Test
- Benutzer:OnkelDagobert:Wikilinks:Psychologie
- de.wikiversity.org પર વપરાશ
- en.wikipedia.org પર વપરાશ
- User:Michael Hardy
- User:Robinh
- User:Itsnotvalid
- User:M.e
- User:Quandaryus
- User:Astronouth7303
- User:Mattman723
- User:Iothiania
- User:Octalc0de
- Portal:Mathematics/Featured picture archive
- User:Dirknachbar
- User talk:BlaiseFEgan
- User:Albatross2147
- User:Klortho
- User:Kvasir
- User:Spellcheck
- User:Heptadecagram
- User:Patrick1982
- User:NeonMerlin/boxes
- User:Cswrye
આ ફાઇલના વધુ વૈશ્વિક વપરાશ જુઓ.